
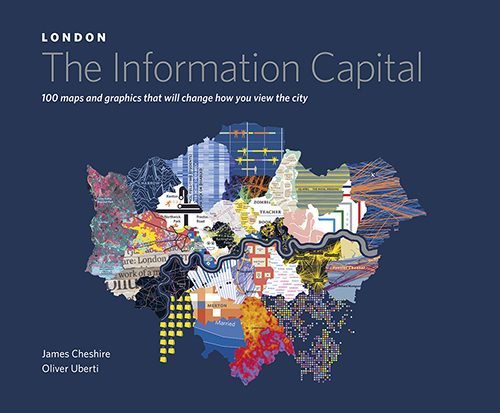
London: The Information Capital: 100 maps and graphics that will change how you view the city
by James Cheshire & Oliver Uberti, Particular Books 2014
More than any other city, London does seem to have an intimate connection with maps. In fact it’s hard to hold an image of the capital in your mind’s eye without Harry Beck’s iconic Tube map creeping into view. Or perhaps without recalling the spiralling aerial photograph from the opening credits of Eastenders. It’s also a city that generates a huge amount of data. Both from traditional sources, such as the census, to more recent sources made possible through smartphones and other modern technology. Using cutting-edge techniques in design and information processing, Geographer James Cheshire and designer Oliver Uberti set out to combine the city’s inherent mapability with this wealth of data to produce a visual spectacle that’s equal parts surprising, informative and beautiful.
The book’s one hundred graphics are divided into five broad themes; where we are, who we are, where we go, how we’re doing and what we like. Each section strikes a perfect balance between conventional subject matter (common commuter routes, ethnic diversity) and much more unlikely topics such as London’s most haunted boroughs, or a detailed breakdown of the cornucopia of curiosities that make up TfL’s yearly lost property haul. In every case the authors have found ever more ingenious ways of presenting the data in visually stimulating ways. Sometimes a graphic will take you to the far flung corners of the earth in order to demonstrate the global reach of Heathrow or to highlight London’s diverse sources of immigration. But it’s never too long before you return to the familiar, awkward ink blot shape of the Greater London boundary, with the reassuring presence of the Thames offing a rare constant in the wildly varying portraits of the city.
For me it was fascinating to learn about the authors’ heroes. Pioneers in the field of cartography such as Phyllis Pearsall, who allegedly walked all 23,000 streets that appear in her first London A-Z (1936). Or trailblazers like John Snow who, in 1854, employed a visual depiction of cholera cases in West London to prove that they were concentrated around the infamous Broad Street water pump. This ultimately led to the discovery that cholera was a waterborne disease. While these historic cases are interesting, the aim of the book is chiefly to deal with information that is as up to date as is feasible. Some of the most striking graphics have only been made possible in the last few years, such as depictions of London’s Tweeting and photography hotspots.
At times the visceral response incited by the beauty of the visuals seems at odds with the unpleasant nature of the data being represented. The graphics showing deprivation, soaring house prices and instances of violent crime are all examples of this. With all the eye-catching pictures it might be easy to overlook the words in this book, but in these cases the text has an important role to play. Again, I feel the authors strike a good balance here by keeping it insightful and thought provoking for these more serious topics, whilst being witty and light-hearted in more trivial cases.
Without a doubt, the book is most at home sitting on my living-room table, where it is a constant source of intrigue for guests and residents alike. It’s a book for sharing and discussing. As the authors are well aware, it might be tempting to think that all of this information would be better presented in some kind of digital, interactive format. The decision of medium was, without a doubt, the right one. So much more can be taken in with a glance across a printed page than can be gleaned within the awkward confines of a tablet screen. Above all else, the book is a lovely, tangible object which captures that particular tactile appeal that you might find in an old OS map or a worn-out desk globe. Whilst technology has been absolutely instrumental in the gathering, sorting and visualising of all of the data that made this book possible. It’s heartening to see that the best format for presenting it remains the traditional print book.
Reviewed by Stephen Startup (Blue Guides staff). Stephen worked on the production of the new Blue Guide London.